pprof 是 Golang自带的一款开箱即用的性能监控和分析工具。 go的pprof提供了2个工具供我们使用,runtime/pprof中是它的源码,net/http/pprof对源码做了简单封装,能让你在http服务中直接使用。
它可以采样程序运行时的CPU、堆内存、Goroutine、锁竞争、阻塞调用、系统线程的使用情况。然后通过可视化终端或网页的形式展示给用户,用户可以通过列表、调用图、源码、火焰图、反汇编等视图去展示采集到的性能指标
使用步骤
1, 在代码中使用 net/http/pprof 来开启,基于 HTTP Server 运行
import _ "net/http/pprof"
2, 生产 profile 文件
# http 服务对外暴露的端口,可以是本地也可以是远程的地址
go tool pprof http://localhost:8090/debug/pprof/profile
3,使用 web ui 来查看 profile 文件
go tool pprof -http localhost:6060 profile.gz
实际使用示例
# 第一步获取 profile 文件信息, 获取后可以直接命令行模式下查看
go tool pprof http://10.0.0.212:7866/debug/pprof/profile
Fetching profile over HTTP from http://10.0.0.212:7866/debug/pprof/profile
Saved profile in /Users/mako/pprof/pprof.polaris-server.samples.cpu.003.pb.gz
File: polaris-server
Type: cpu
Time: Jul 15, 2024 at 2:57pm (CST)
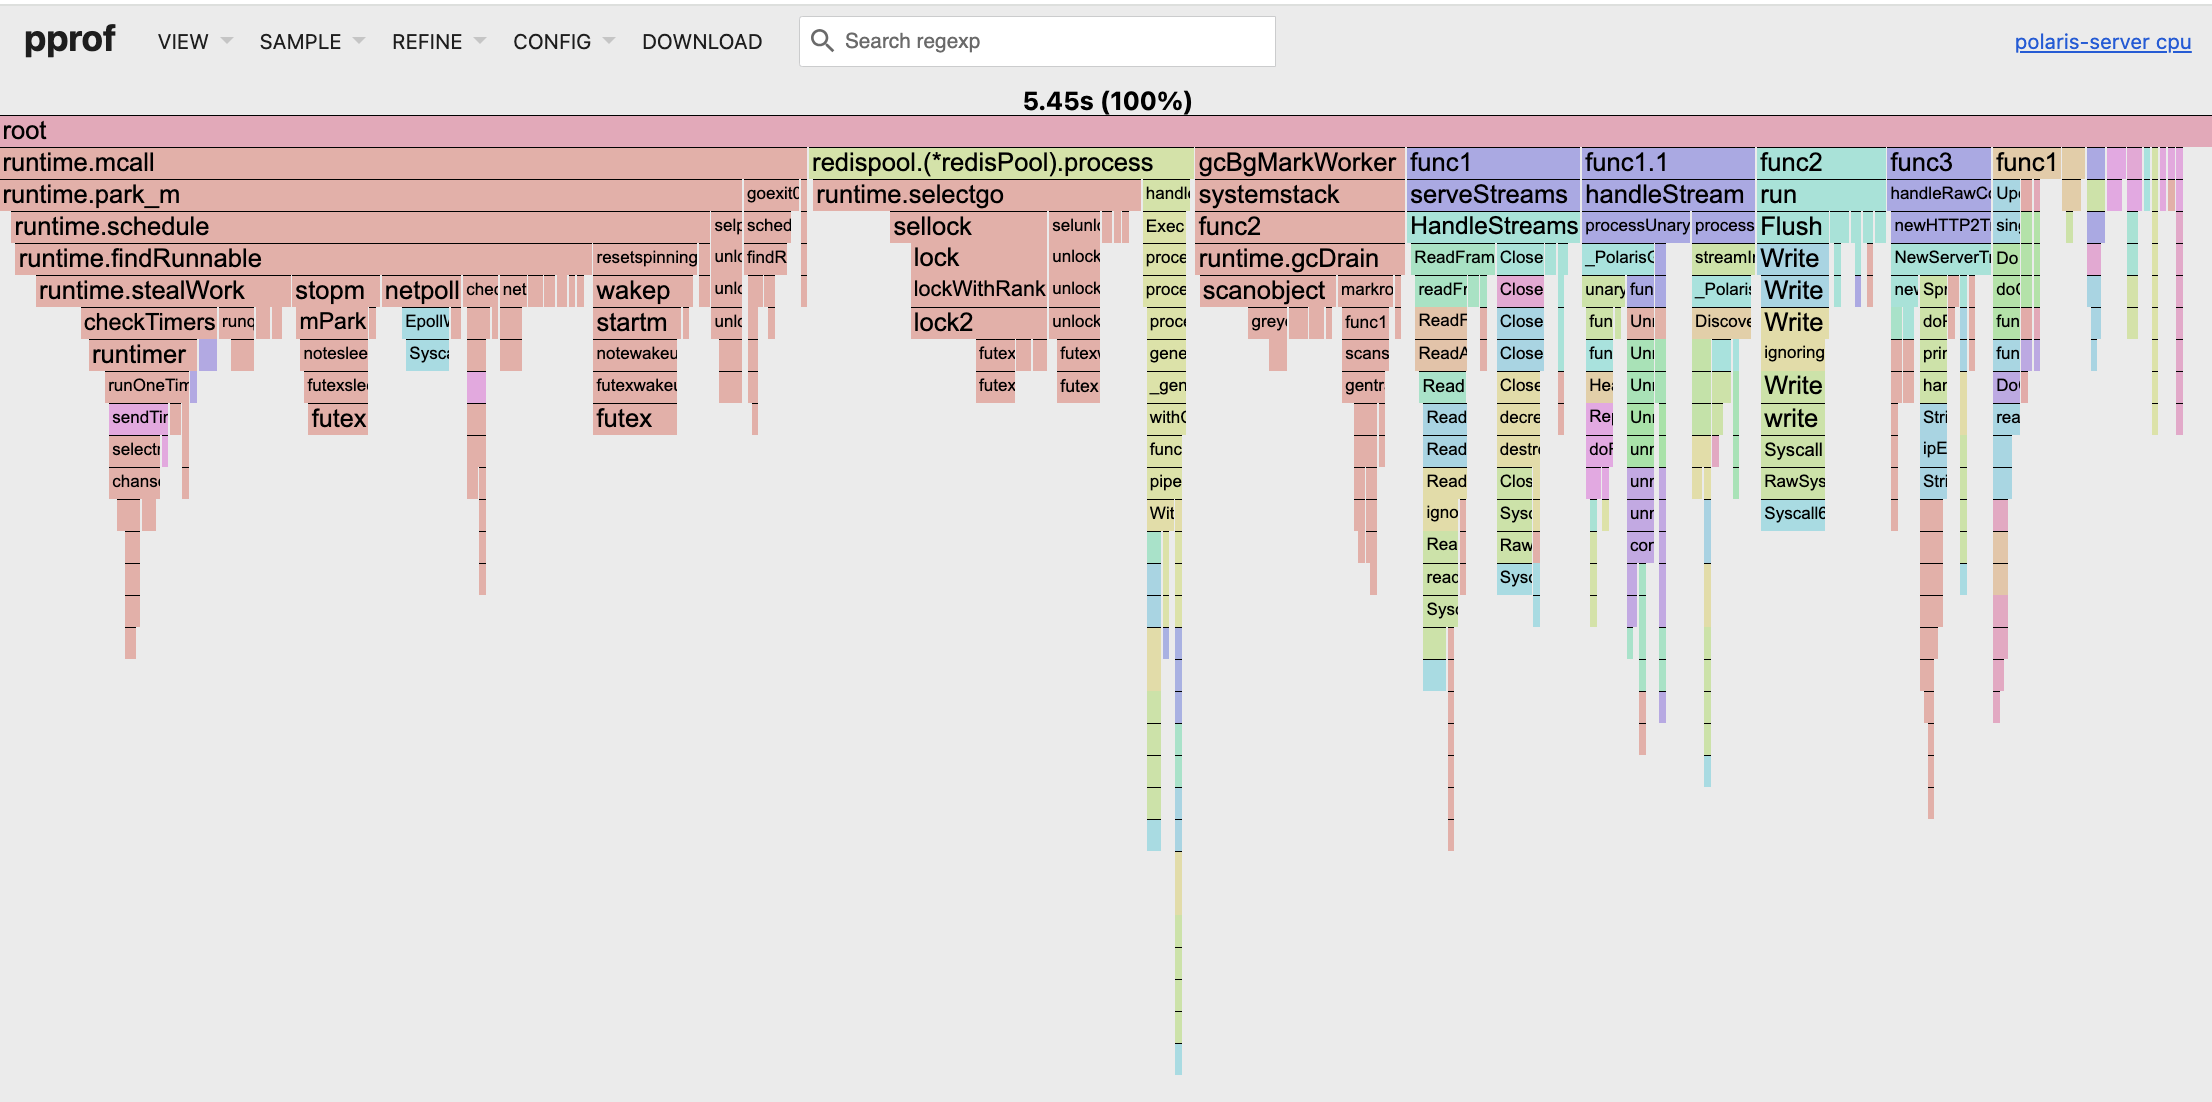
Duration: 30.03s, Total samples = 5.45s (18.15%)
Entering interactive mode (type "help" for commands, "o" for options)
(pprof)
# 使用web ui 查看
go tool pprof -http localhost:6060 pprof.polaris-server.samples.cpu.003.pb.gz
Serving web UI on http://localhost:6060
效果